Logging In
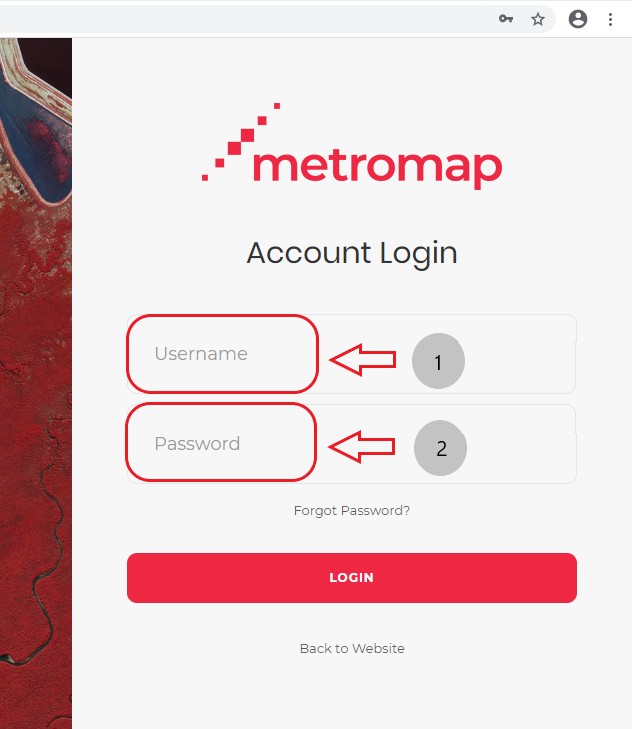
When you login to MetroMap, you will get the login screen:
- Enter your username or email1
- Enter your password2
- Click LOGIN
1 This is the username you have received in the E-mail from us.
2 If you have forgotten your password, you can reset it here by following the instructions from Forgot Password? link on the screen.
MetroMap Browser 2D Interface
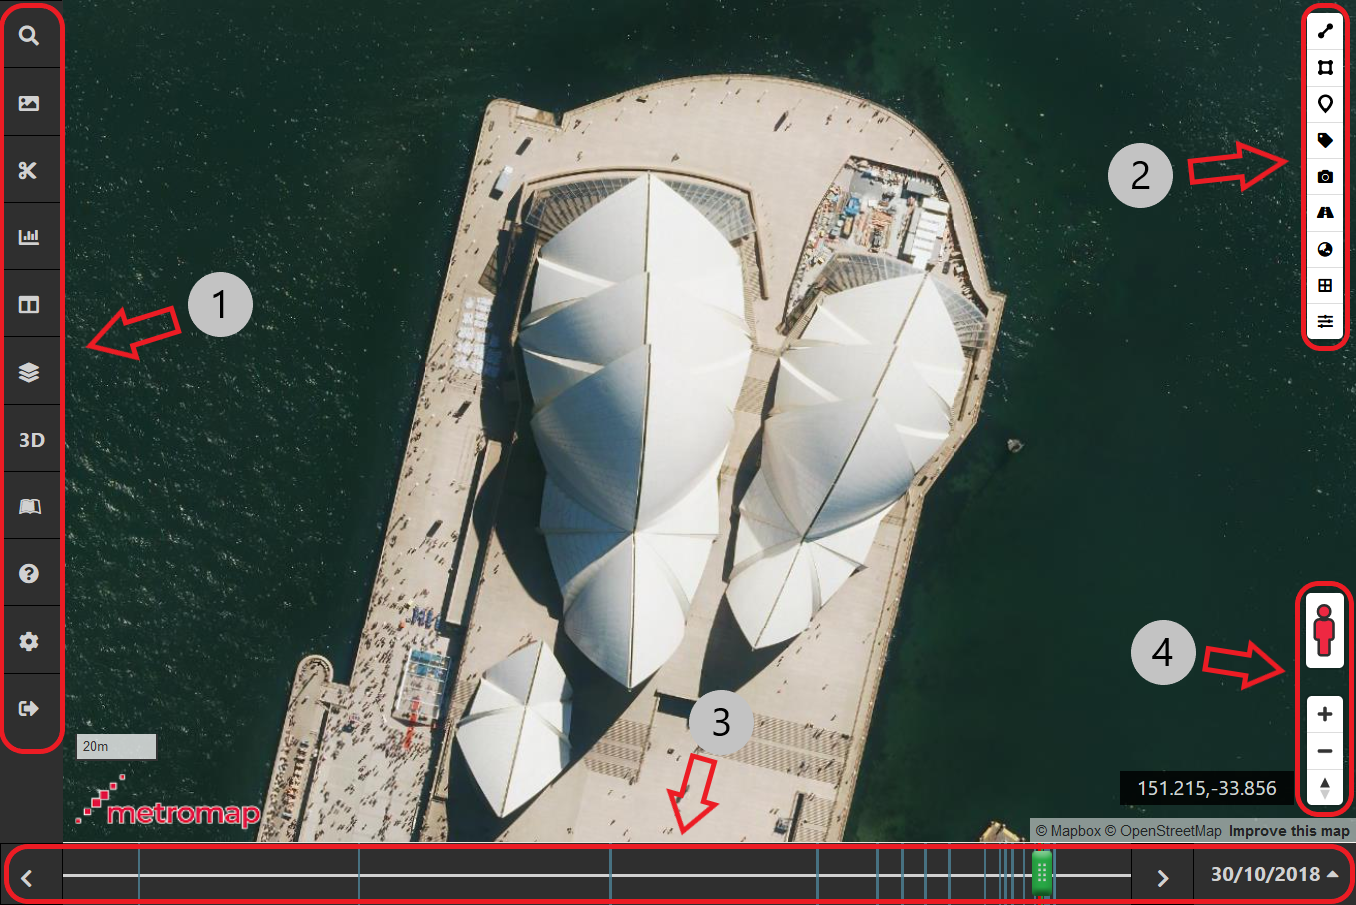
The MetroMap Browser 2D Interface is constructed by the following elements:
1. Menu
| Icons | Tool | Descriptions |
|---|---|---|
 |
Search | The Search button toggles the Search bar which allows for location searching via either address or coordinates. |
 |
Download | The Download button allows you to download imagery data through your browser for offline usage. |
 |
Clip it! | The Clip it! tool allows you to download larger, full resolution imagery, for offline usage. You will receive a link to download the imagery via email. |
 |
Swipe | The Swipe button allows you to compare two different datasets at the same time but swiping between them. |
 |
Layers | The Layers button opens the menu that allows you to manage your vector data layers. |
 |
3D View | Toggle the 3D Viewer Interface |
 |
Documentation | The Documentation button brings you into our documentation site, containing explanations and guides for all aspects of MetroMap. |
 |
Map Preferences | The Map Preferences button allows the configuration of map settings. |
 |
Logout | The Logout button logs you out. |
2. Tool Bar
| Icons | Descriptions | |
|---|---|---|
 |
LineString | The LineString tool allows the user to create and accurately measure a line. Once selected left clicking creates new points and double clicking finishes the line. You can then export the line as a KML file. Video demonstration. |
 |
Polygon | The Polygon tool allows users to accurately calculate areas using polygon shapes. Once selected left clicking creates new points and double clicking finishes the area. You can then export the area as a KML file. Video demonstration. |
 |
Circle | For Enterprise Plans: The Circle tool allows users to create and calculate circular areas with a circle shape. Left-clicking first places the centre-point and a second click places a point of the outer ring with the straight-line distance between being the radius of the circle. Information available includes circle area, radius, and circumference. After saving, you can export the area as a KML file. |
 |
Marker | The Marker tool allows users to pin point a location and get its coordinates. Once selected left clicking creates new marker on the map. You can then export the marker as a KML file. |
 |
Text Label | The Text Label tool allows users to add a text label onto the map. |
 |
Screenshot | The Screenshot tool allows the user to download a georeferenced or non-georeferenced JPG screen shot of the current view. Video demonstration. |
 |
Toggle Roads | The Toggle Roads button toggles the display of roads. Video demonstration. |
 |
Toggle Imagery | The Toggle Imagery button allows you to toggle MetroMap Imagery on and off. Video demonstration. |
 |
Toggle Bounds | The Toggle Bounds button allows you to toggle MetroMap Bounds on and off. Video demonstration. |
 |
Adjust Colour | The Adjust Colour Button allows you to change the colour, contrast, or sharpening amounts as desired. Video demonstration. |
3. Date Slider
Metromap shows the Australia Latest Layer by default. The current imagery’s date is shown at the bottom right.

When you move your mouse cursor, the text updates to the latest capture date of the area under your cursor.
To turn off the latest layer, click the "Latest Layer" button and select another date. When the latest layer is off, you'll see the date slider.
The Date Slider allows you to select different imagery for the current location.
You can change the date by :
- Dragging the green slider horizontally.
- Clicking the left or right arrows.
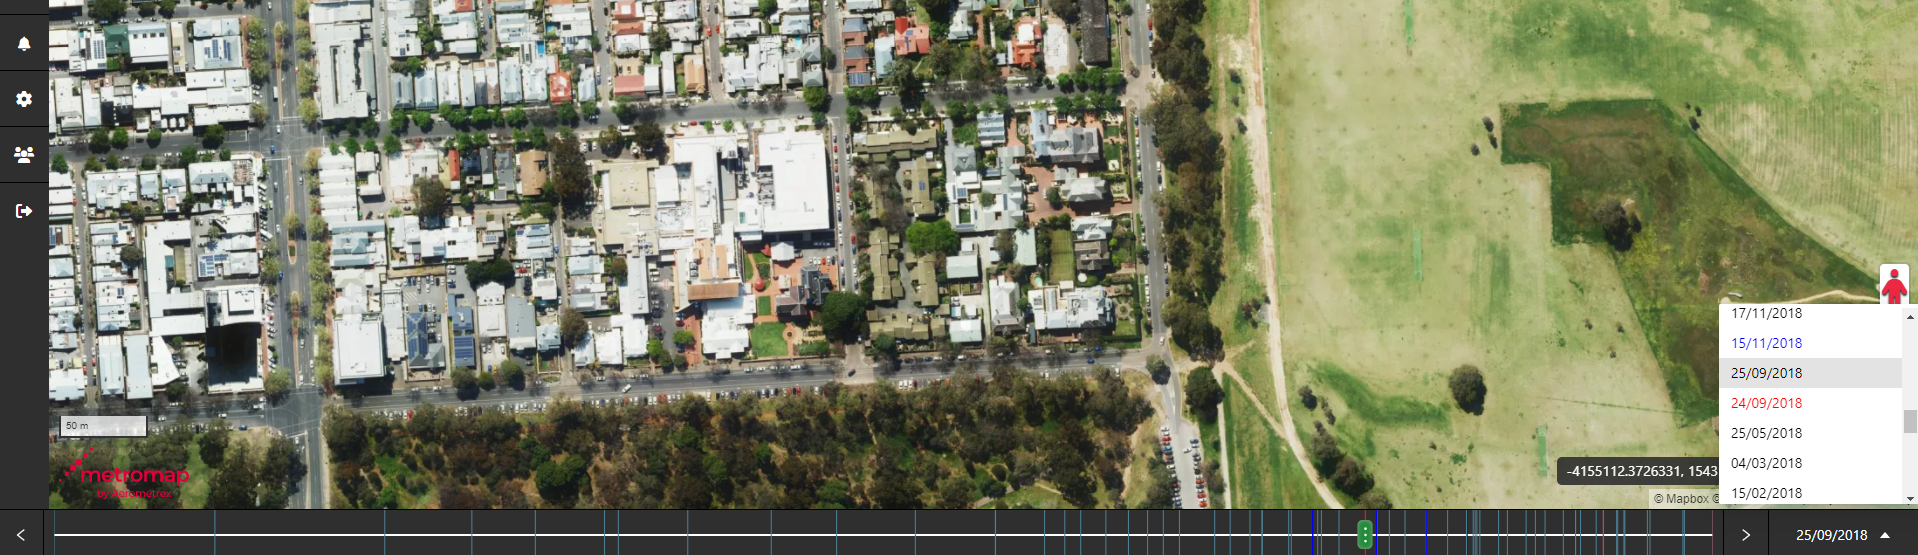
- Clicking the displayed date in the list.
A black line indicates high resolution imagery captured by Aerometrex.
A red line indicates the imagery on that date is a near infrared layer (NIR).
A blue line indicates the imagery was captured by Eagleview.
MetroMap will only show a single map at a time
Apart from dragging the slider, you can also select the date from the drop list. Simply click the displayed date you will be presented with a dropdown box listing all available dates for the current area.
4. Navigation
| Icons | Descriptions | |
|---|---|---|
| Street View | The Street view button can be dragged onto a street to display the Google Street View of that location. Video demonstration. | |
  |
Zoom In Zoom Out |
The Zoom In and Zoom Out buttons allow the user to view a specific zoom layer, from an entire city to a single building. |
 |
North Arrow | The North Arrow can be dragged to rotate and shift the perspective of the imagery. The perspective can also be rotated by holding right click and dragging the mouse. If you want to reset back to the default simply click the button. |