Before you start
This section introduces various tools that MetroMap provides in 2D interface
* For 3D Interface tutorial, please refer to 3D in MetroMap.
 Search
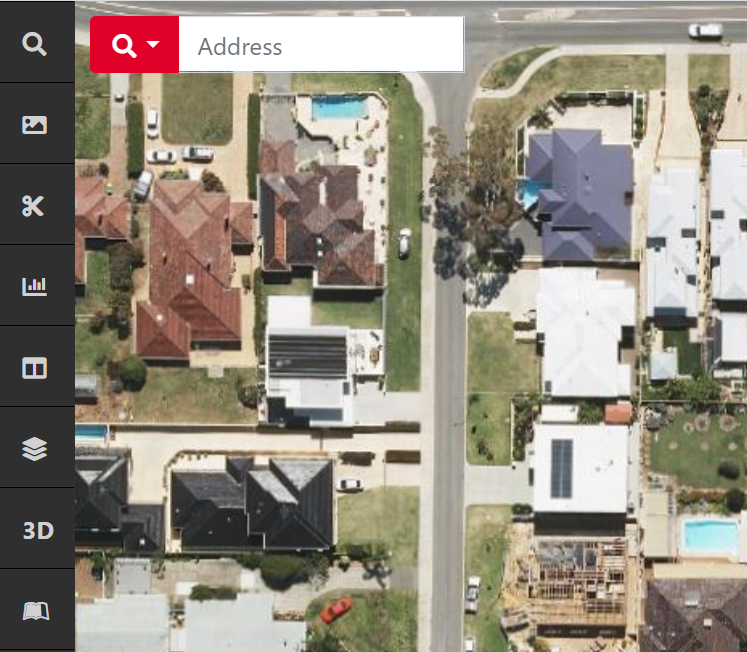
To find a specific location and get to that part of the map quickly, click the Search button, then type your search query into the search bar in the upper left part of the MapViewer. You can search for Australian locations only.
Search for Location by Street Address
Like with other online maps you may use, simply type in the street number, street name, suburb/city or postcode, state and the MapViewer search will return more accurate results. Once a result is selected, the MapViewer zooms to the specified address and places a red Location pin on the map.
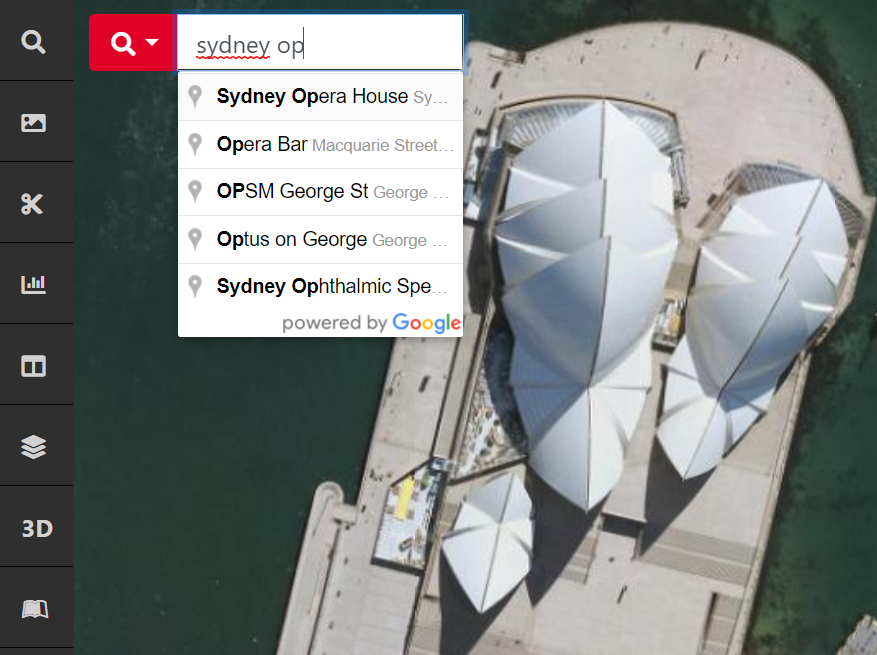
Search for Places of Interest
Places of interest can also be searched for, making the search for tourist attractions, zoos, stadiums, universities, places of worship much easier and more intuitive. Using the Search bar, you can type in the name of a landmark like “Sydney Opera House” or “Sydney Harbour Bridge" and MetroMap will take you there.
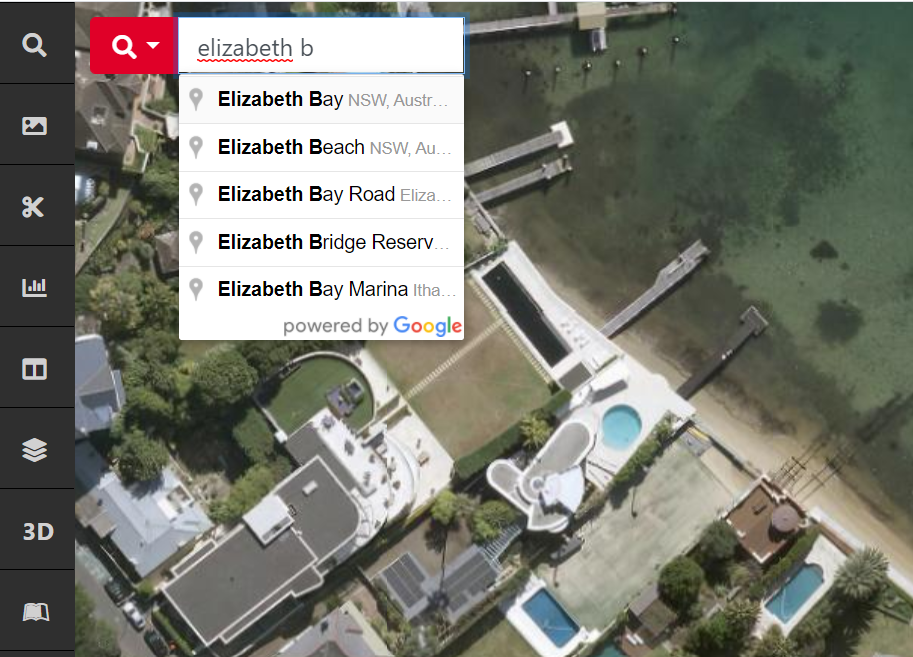
Search for Suburb
If you would like to explore a suburb, type in the name of the suburb in the search bar and you will then be presented with a MetroMap image layer centered on this suburb. If this suburb name exists in different states, the search results will provide you with options to choose from, and you can select which one to view.
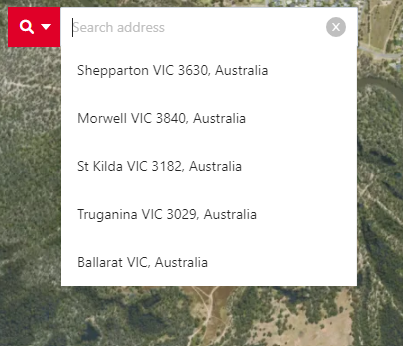
For address searches, the five most recent searches will be available in the Search tool's history:
Search for Coordinate
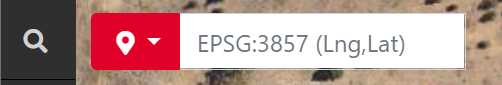
To search for a coordinate, change the red drop down on the Search Bar to the Point Icon. The coordinate search function uses the same projection as the whole MapViewer. To change the projection, go to Map Preferences and change projection. The default supports Decimal Degrees coordinate searches:
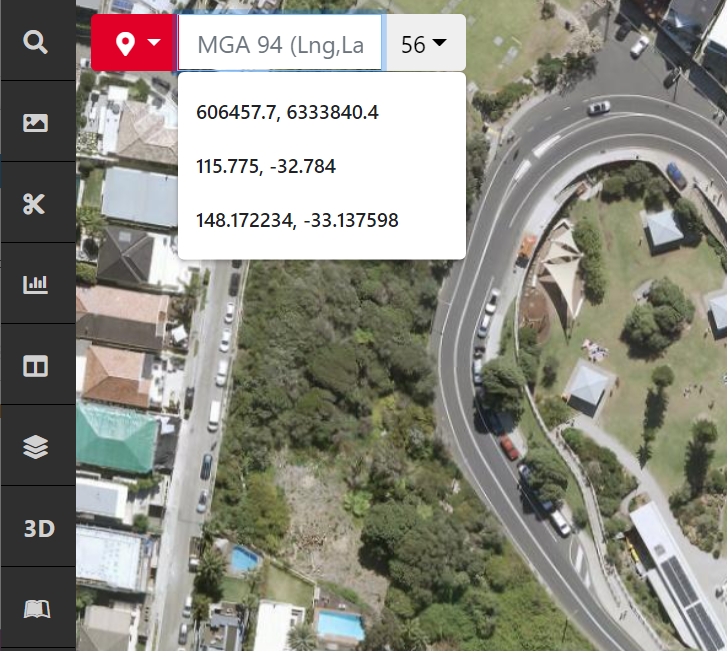
When searching in a projected coordinate system such as GDA94 or GDA2020 MGA Zones, a drop down box will appear at the end of the coordinates search box, its default is to automatically select the correct MGA Zone at that location. The default for this projection supports meters, or eastings and northings coordinates.
Your most recent searches will also be remembered in the Search Box:
 Share Link
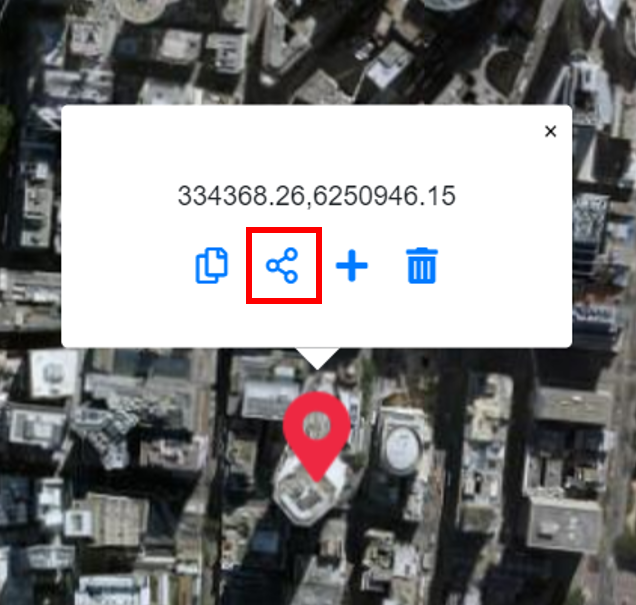
After searching for a location or coordinate, you can share this with a colleague or another MetroMap customer. Simply click on an existing marker, or draw a new marker. Then click on the share icon:
By default, the link will bring you to the location at the same Zoom Level that you are currently displaying. To change the Zoom Level, click the Zoom button to open a drop down menu. To get the best from our high resolution imagery, we suggest you use Zoom Levels 19 to 21
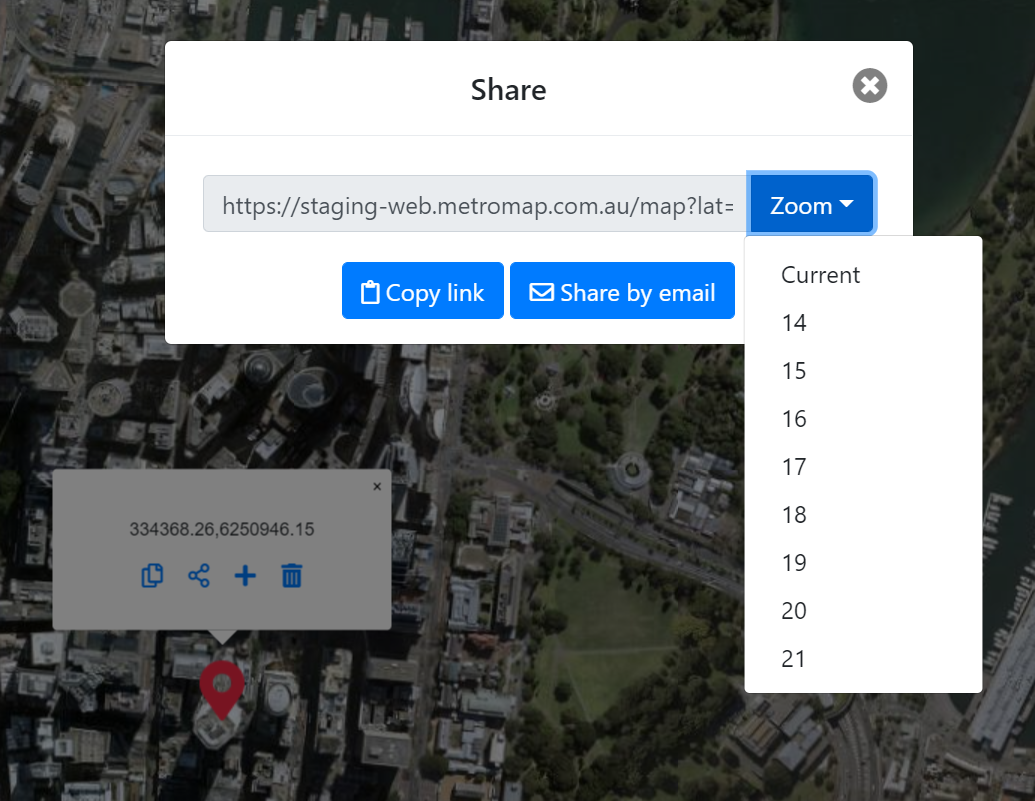
You can either copy the link to clipboard by clicking Copy Link, or you can share through email by clicking Share by Email, then enter the recipients address and click Send.
 Download
The Download button allows you to download reasonable resolution imagery data for offline usage. Select an area you would like to download.
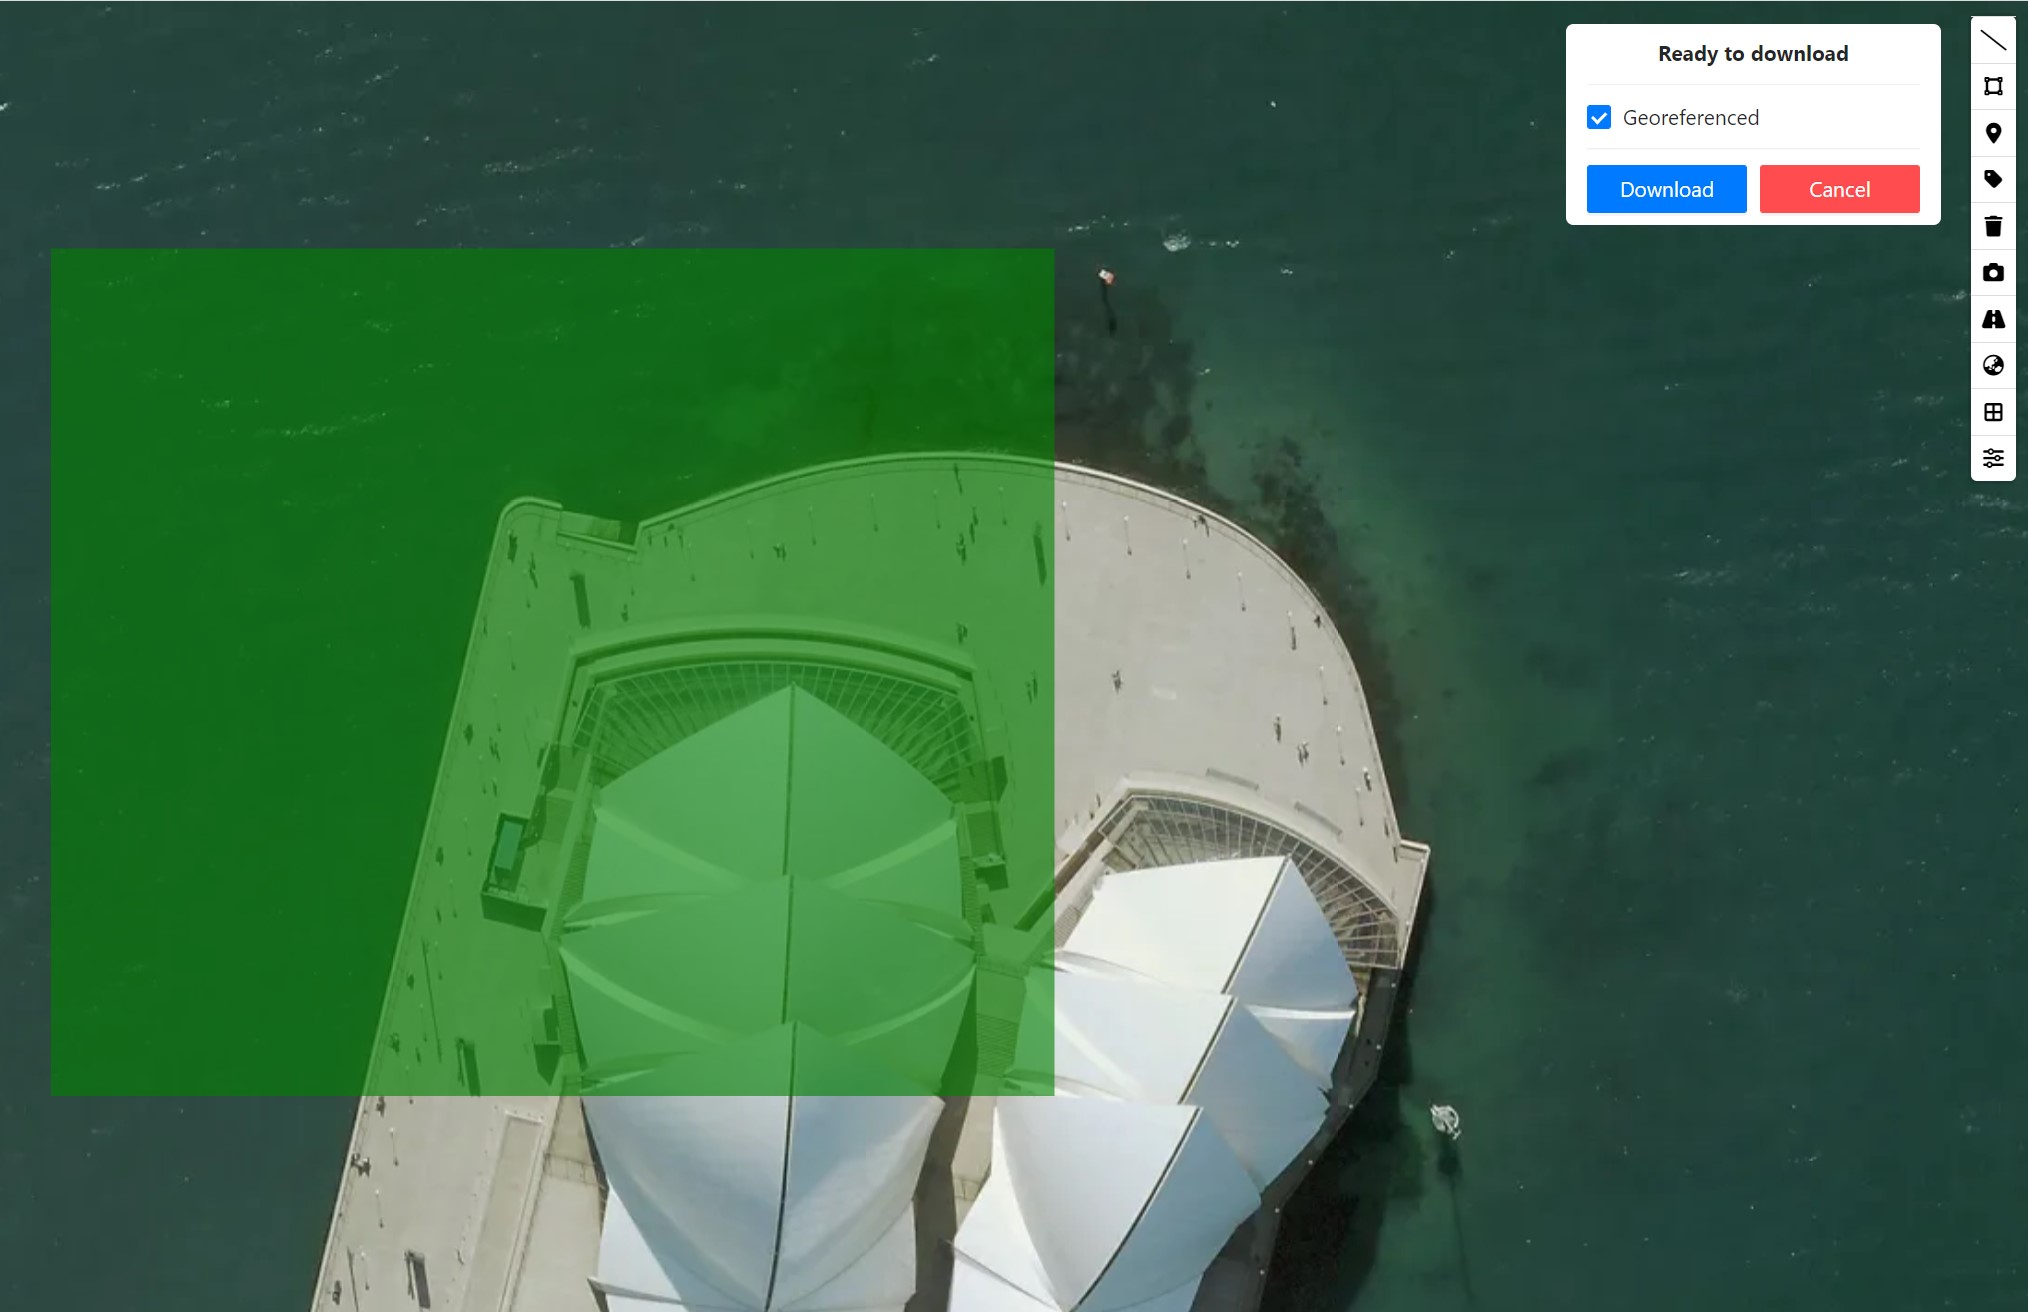
After you click Download a pop up will open, save to local file location
If you change your mind and don't want to save the inage, press Esc on the keyboard will exit the Download interface.
- If you choose not to download the georeferenced version, the file will be saved locally to your computer as JPG format.
- If you would like to download the georeferenced version, the file will be saved as a ZIP file, the
zipfile includes ajpgfile, and its geolocation information stored as.jgwand.prjfile.WGS 84 / Pseudo-Mercator EPSG:3857is the projection for the Download tool and what georeferenced imagery will be delivered as.
Please note that our MetroMap platform can provide imagery in various projection systems.
For more introduction about this and Projection Systems, please refer to Clip It!.
 Clip It!
To download larger, full resolution imagery, with more options and flexibility for projections and formats, you can use Clip It!. This tool is perfect to export small, high resolution, high spatial accuracy imagery to use in offline desktop software such as ESRI and AutoCAD.
- Similar to the Download function, select an area you would like to download.
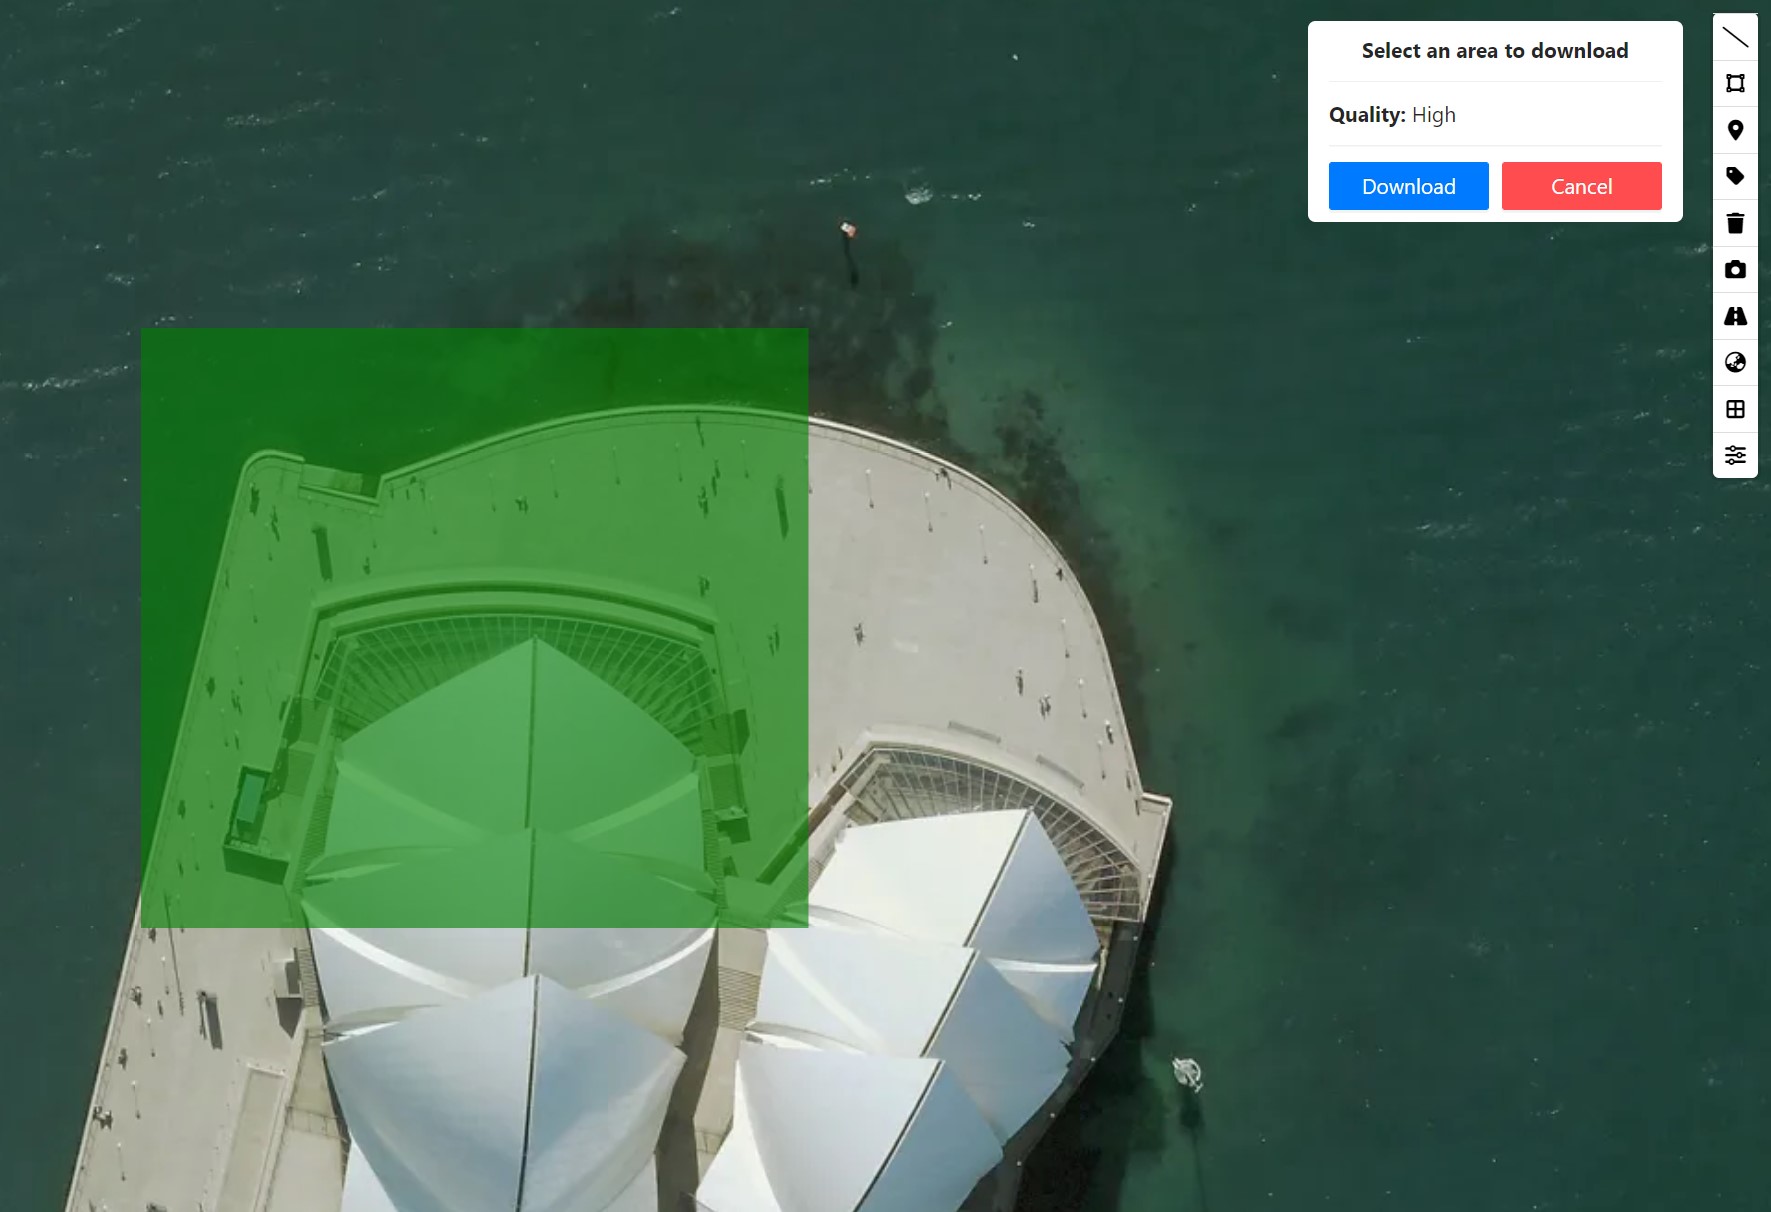
This tool is limited to a 2500km2 export area, if the green box turns orange or yellow, the resolution will be reduced to Medium and Low respectively
-
After you click the Download button, you will need to choose which projection system and the image format you want to use.
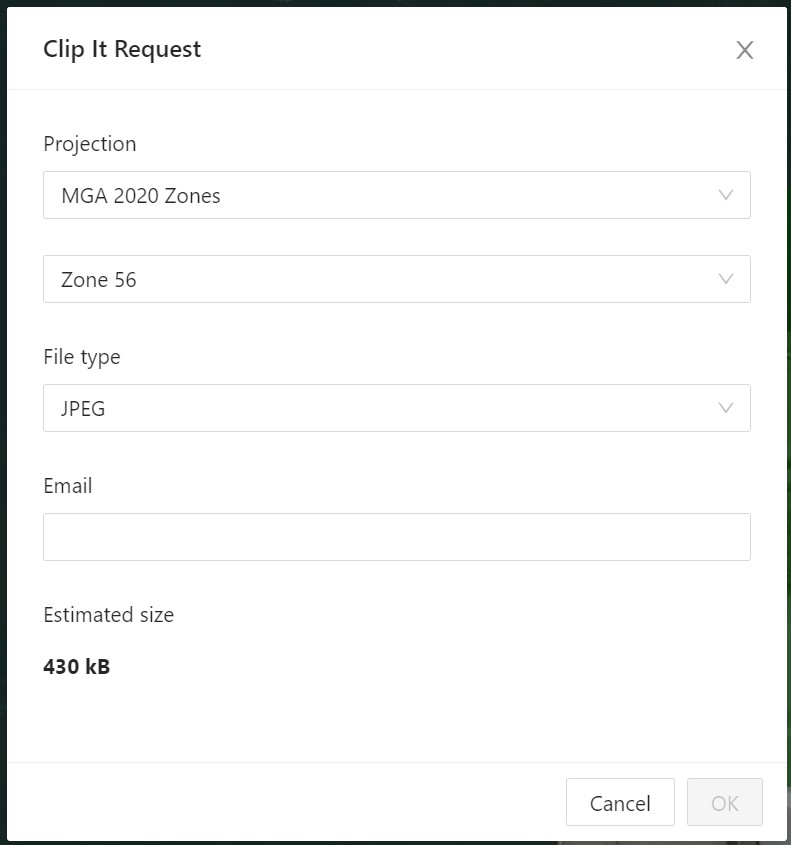
MetroMap provides various projection systems, which includes:
WGS 84 / Pseudo-Mercator EPSG:3857GDA 94 Geographic Lat/Lng EPSG:4283GDA 2020 Geodetic coordinate system ESPG:7844MGA 94 ZonesMGA 2020 Zones
MetroMap also provides different image formats, which includes:
GeoTiffGeospatial PDFJPEGPNGIMG
Choose JPEG to have the smallest 'Clip It' export available, you'll recieve this faster via email
- After choosing the configuation, fill in your Email address, then click OK.
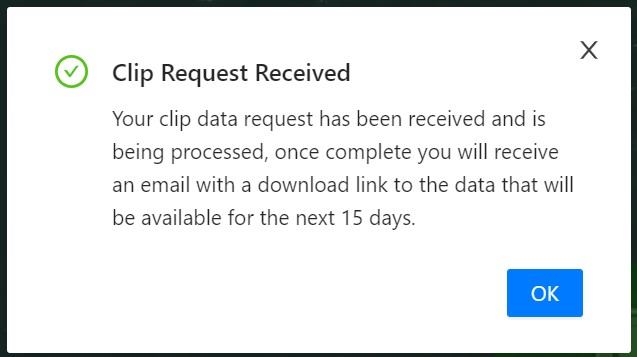
You will then receive a download link from MetroMap. The link will lead you to a Zip file contains a image file and a location record file, please download it once you receive the email as the link will expire in 15 days.
 Map Swipe
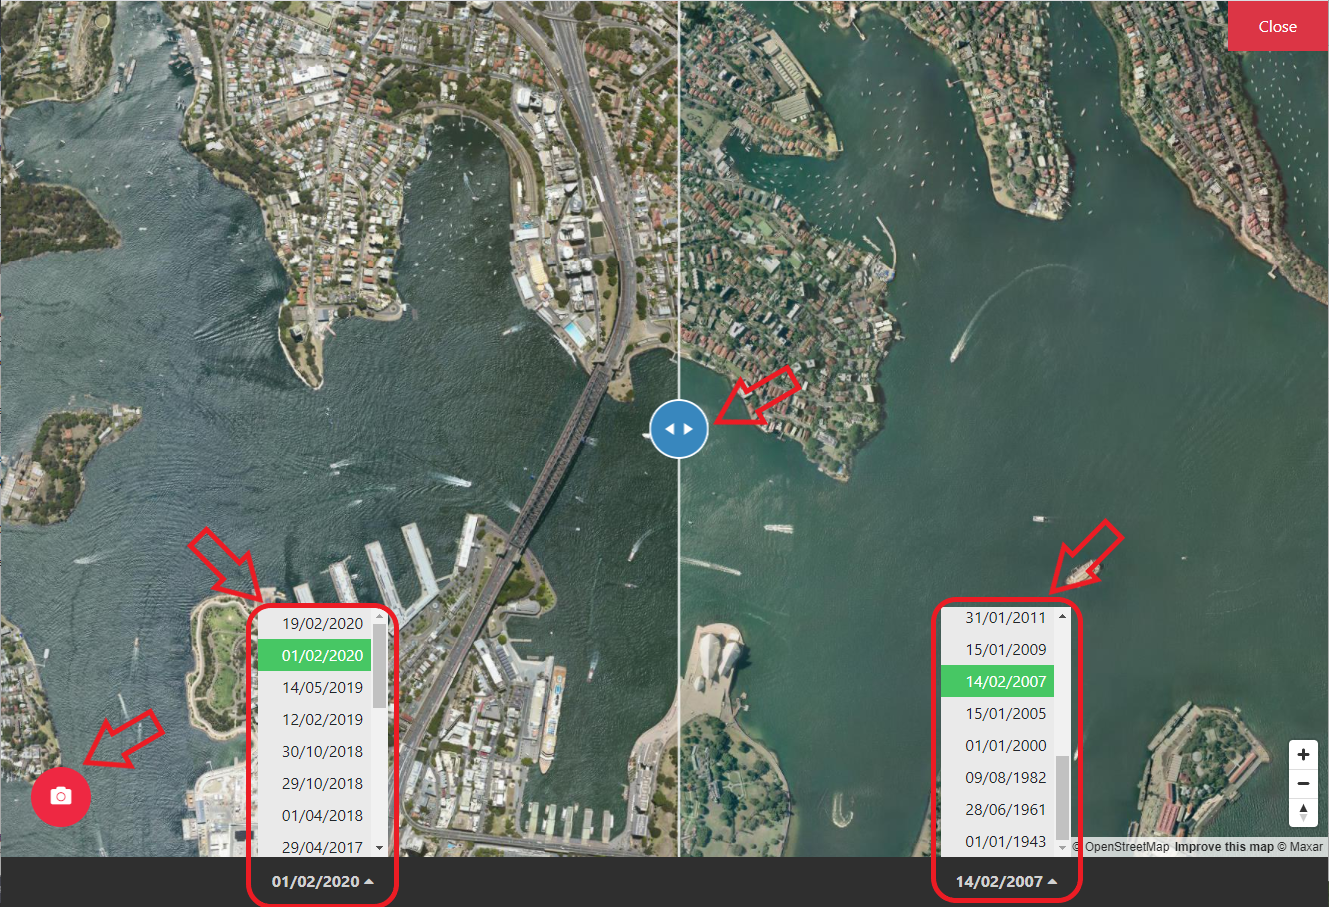
The Map Swipe tool allows you to compare two sets of imagery of the same location.
Simply choose imagery from different dates using the collapsible list at the bottom. You can also take a screenshot by clicking the Screenshot button at the bottom-left. The Blue handle was designed for you to drag revealing the difference between 2 set of times on the same spot. When you finish, close Map Swipe by clicking the Close button in the top-right corner, you will then return to MetroMap browser.
 Layers
The Layers Menu allows you to view and control the layers you have on the map. Click the Layers button to expand the Layers menu.
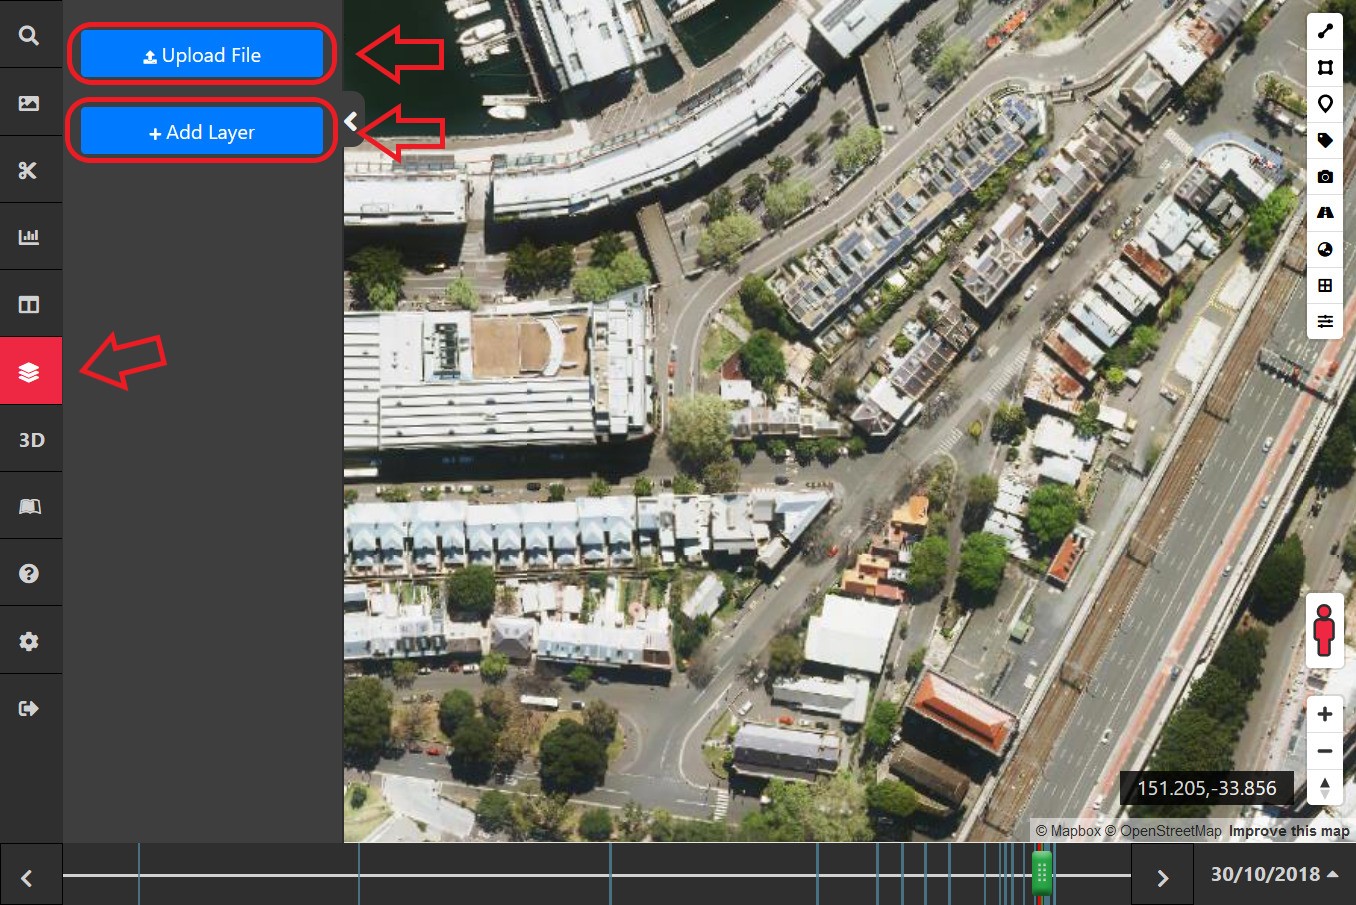
You will have two options if you want to add extra layers, you can click Upload File button to upload your own layers or click + Add Layer to choose the add-on Geoscape data that MetroMap provides.
Upload Geometry Files
MetroMap supports GeoJSON, KML, KMZ and Zipped Shapefiles. You can choose the file from File Picker or simply Drag-and-drop your Geometry Files onto the map layer.
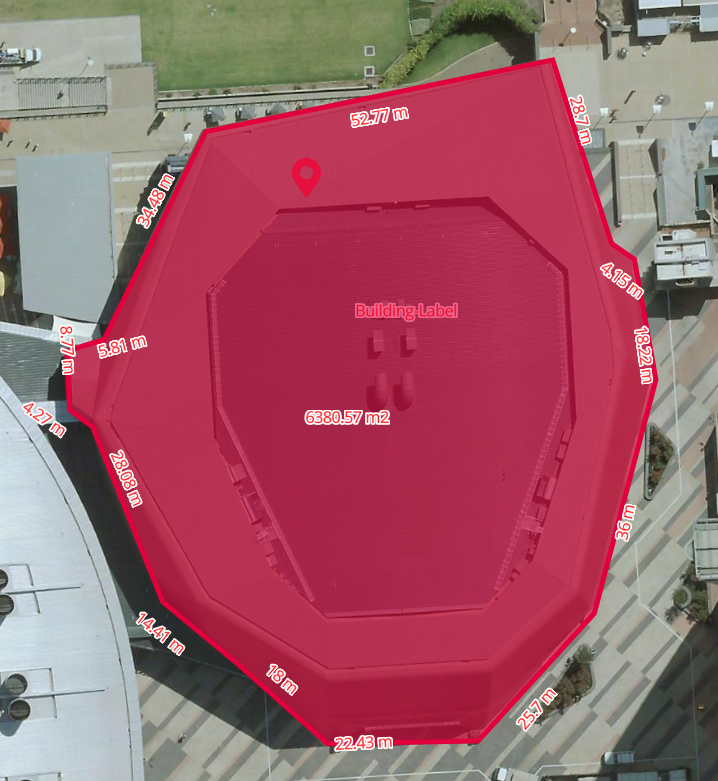
Please note that measurement text will not be displayed on polygons with more than 50 vertices.
And MetroMap currently only supports Single point, Polygon and LineString geometry.
1. Upload through File Picker
Click on the Upload File button to open a popup.
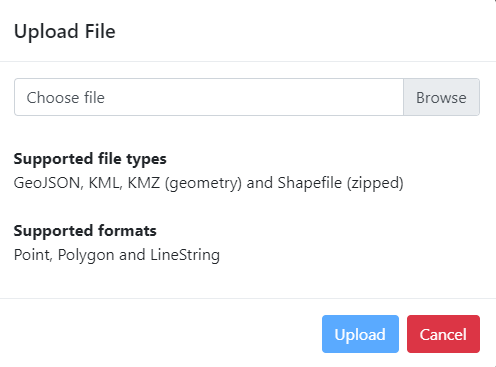
Click Browse to choose a file from your computer, then click Upload to upload the file.
Enter a name for the layer (it doesn’t need to be the same as the file name). Click Add and it will be added to the map and the layers menu.
2. Drag-and-drop
Drag a file from your computer and drop it onto the map.
Same as the file picker method, a popup will appear and ask you to enter a layer name. The geometry will then be added to the map and layers menu.
Add Predefined Layers
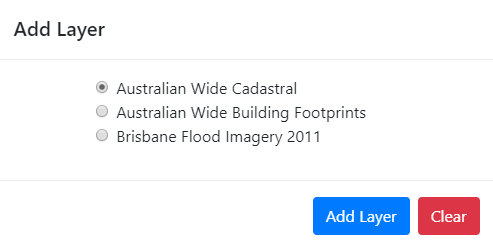
MetroMap's built-in layers now include Geoscapes Cadastre and Building Footprints.
Click + Add Layer then choose which layer to overlay on the map display.
Customising Layers
| Polygon Option Menu | Label Option Menu | Example |
|---|---|---|
 |
 |
 |
- You can rearrange layers by dragging the name of the layer up or down.
- If you would like to delete the layer, simply click
 beside the name of the layer.
 - Click the
 to open the options panel for that layer.
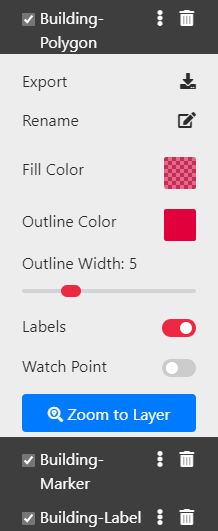
- For polygons, you can change the fill color, outline color, outline width, toggle the measurement labels and toggle the Watch Point.
- For linestrings, you can change the line color, line width, and toggle the measurement labels.
- For markers, you can change the marker color and toggle the Watch Point.
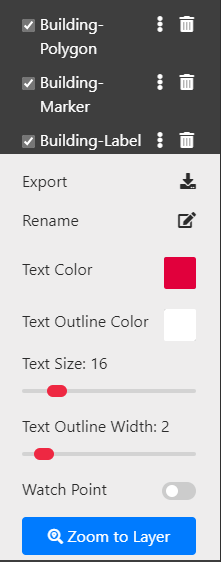
- For text labels, you can change the text color, text outline color, text size, text outline width and toggle the Watch Point.
- To rename a layer, click on
 then enter names in the following pop-up box.
 - Click on the Fill Color box to open a color picker panel for that element. You can use the color picker to change the color and transparency.
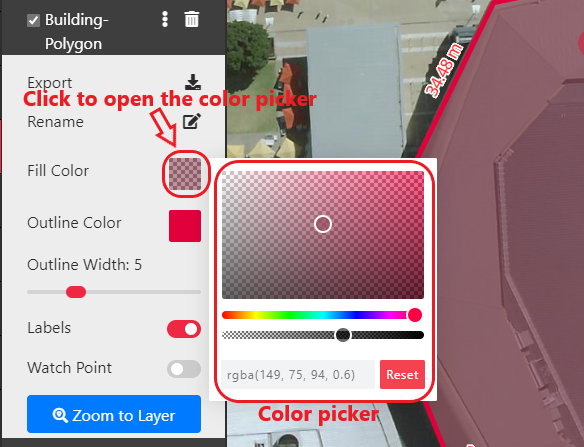
- Drag the small circles to change the color, hue and transparency. Or click the Reset button to reset to default color.
* You can turn the measurement text on/off through the option panel.
* Changes are shown on the layers instantly. After you get the color you want, simply click outside of the color picker to close the panel.
- Drag the small circles to change the color, hue and transparency. Or click the Reset button to reset to default color.
- Click the Zoom to Layer button to zoom in. Alternatively you can click the layer name to zoom in as well.
- You can also create layer from MetroMap, please refer to Tool Bar.
Watch Point
Watch Point allows you to be continuously notified when there is a new imagery layer avaliable for the area(s) that you are interested. If you have added layers to the map through Tool Bar or Upload File, you can make make it a Watch Point.
-
In the Customizing Layers, Click the
to open the options panel for that layer. -
Click the swich to toggle the Watch Point.
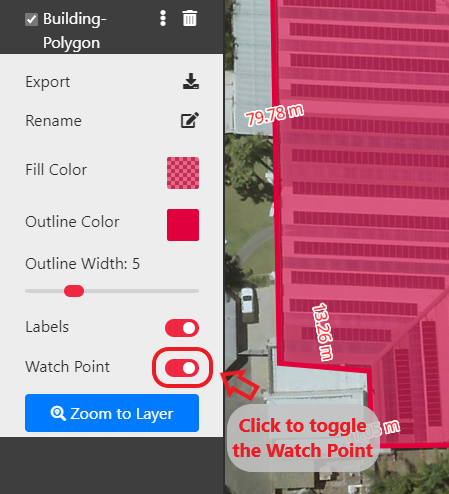
-
You will be notified via Email when there are new imagery layers for the areas where your Watch Points locate.
Noted that most of the marking methods (polygons, markers and labels) can be added as Watch Point, except for lines.
Buffer Tool
Available for Enterprise users, the Buffer Tool brings the functionality of applying a buffer to any saved layers, whether it be a polygon, circle, line or marker point. Layers can either be visually expanded with a positive buffer, or shrunk with a negative buffer.
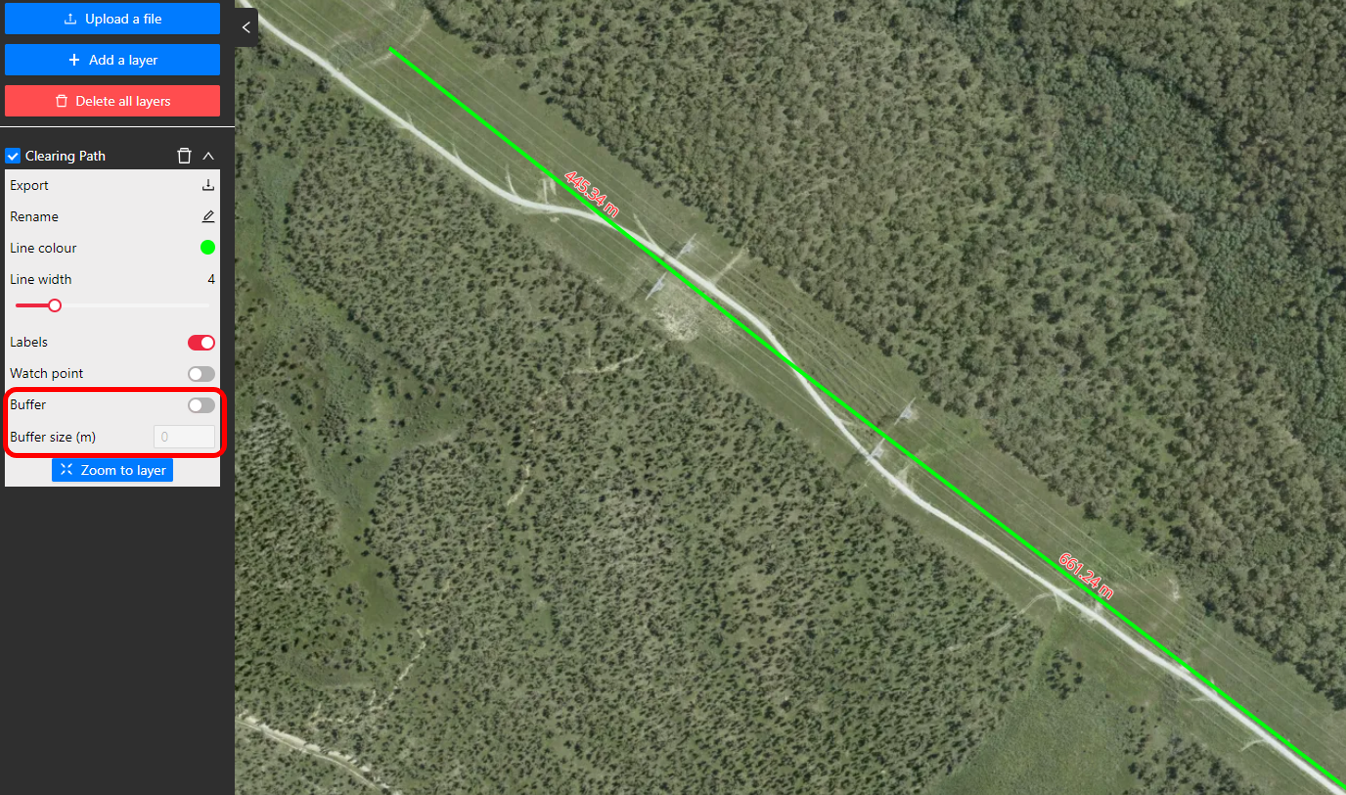
To apply a buffer to a saved vector layer, open the Vector Layer menu then click to expand the saved layer's options. A buffer can then be applied by toggling on the Buffer option and entering a buffer size (in metres). When the buffer applied is expanding the layer area, the buffer will be displayed as yellow.
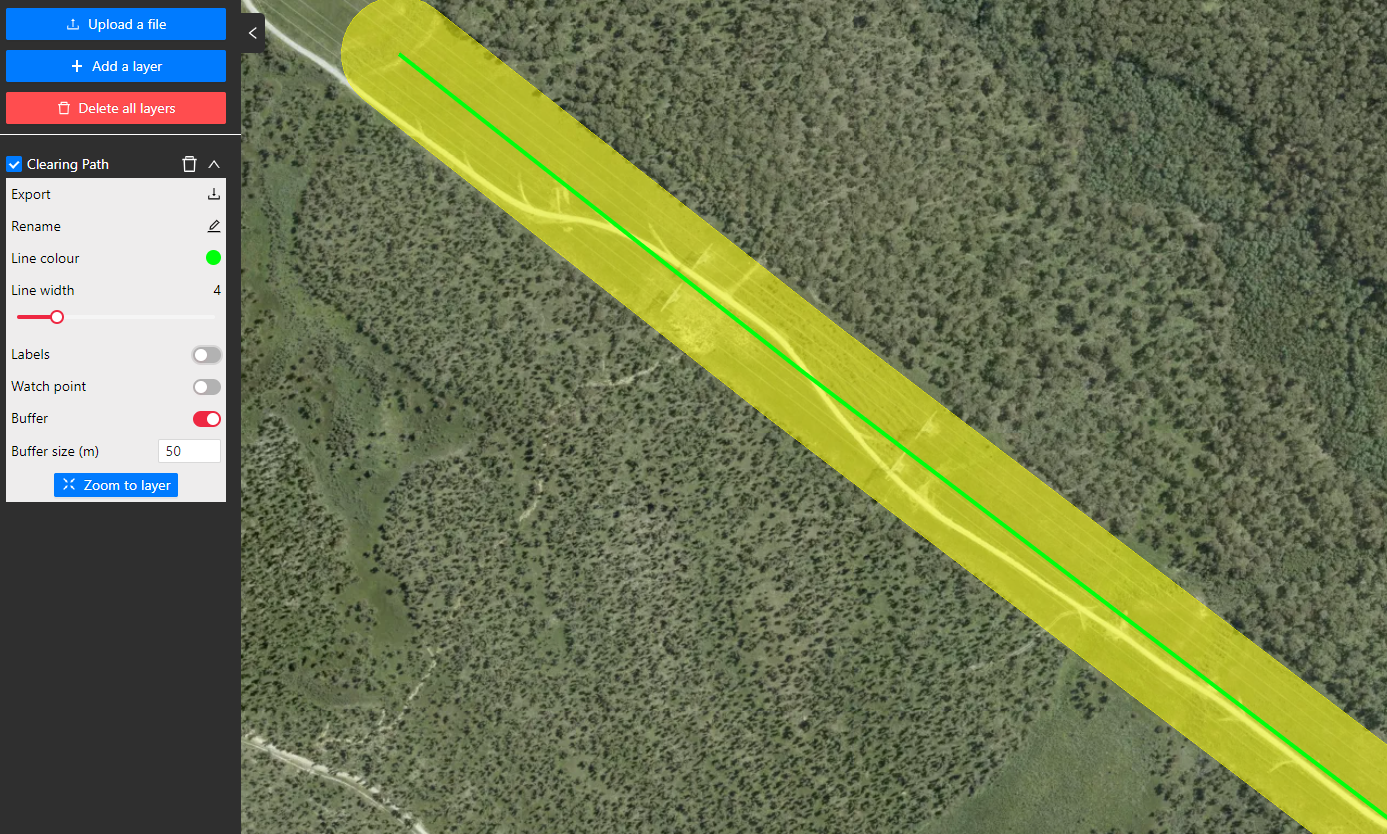
If a layer has a buffer applied, exporting the layer to a KML will export the buffer as well.
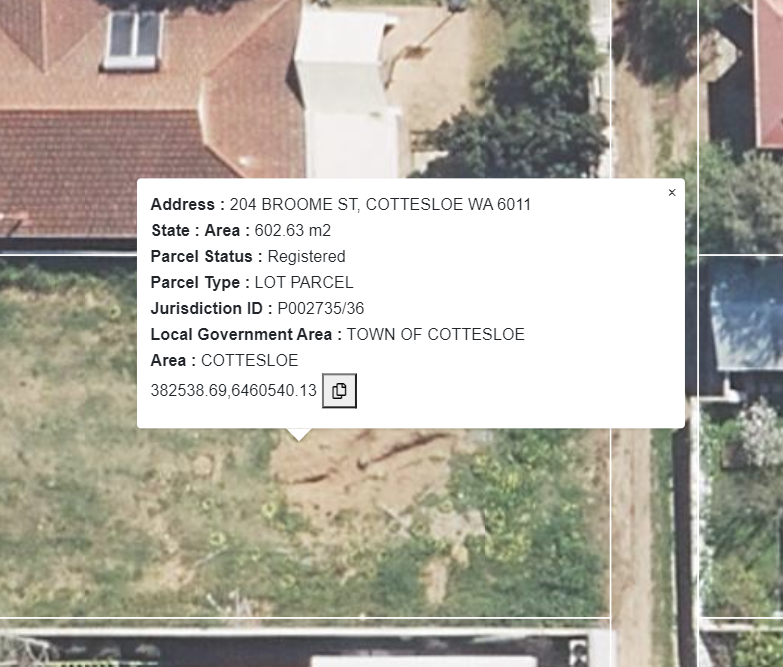
Layer Info
If an uploaded layer has information attributed to that feature, then MetroMap can display that data to provide more meaningful analysis. This is called attribution.
Simply click on the geometry on the map display to see any information attached:
 Map Preferences
The Map Preferences button allows the configuration of map settings.
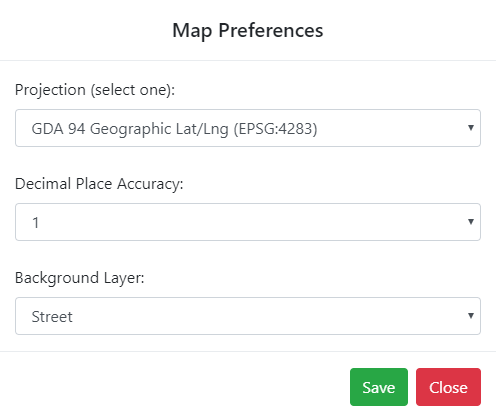
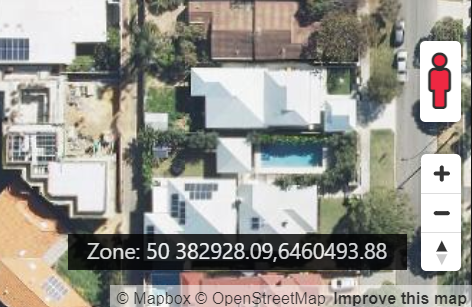
You can change Projection and Decimal Place Accuracy for the browser display. This will update the units of measurement and decimal places. For more accuracy, select the highest decimal place accuracy available for that Projection. The example below shows where GDA94 MGA Zone 50 has been selected in the Map Preferences and the map units have updated to show this:
You can also choose Street Map Background or Satellite Map Background for the basemap imagery layer.
MetroMap provides the following projection systems:
WGS 84 / Pseudo-Mercator EPSG:3857GDA 94 Geographic Lat/Lng EPSG:4283GDA 2020 Geodetic coordinate system ESPG:7844MGA 94 ZonesMGA 2020 Zones
 Admin Panel
Available to admin permission accounts as part of Enterprise or Team subscriptions, the Admin Panel button opens the Admin Panel where user accounts are able to be created and managed. Guides and more information are available here: Admin Panel
Tool Bar
Metromap has tools that create markups on the map display, these can be found in the Tool Bar. These can be saved as Layers and shared with the export tool.
 Line,
Line,  Polygon,
  Circle,
  Marker and
  Label Tools
| Icons | Usage | |
|---|---|---|
|
LineString | Accurately draw and measure a line. Left click on the prefered spot to start the line. The line measurement will update dynamically to show the length of each segment. Double click at the last point to finish the line. Once saved as a Layer, you can then export the line as a KML file. Video demonstration. |
|
Polygon | Accurately markup and calculate areas using polygon shapes. Left click on the prefered spot to start drawing the area. The segment measurement will update dynamically to show the length. Continue to place clicks that mark around the area of interest. Double click at the last point to finish the Polygon. Once saved as a Layer, you can then export the Polygon as a KML file. Video demonstration. |
|
Circle | For Enterprise Plans: Create and calculate circular areas using the Circle drawing tool. Click to place the centre-point and move the cursor to enlarge the circle before clicking again to complete the circle. Information available includes circle area, radius, and circumference. Saved circle shapes can also be exported as a KML file. |
|
Marker | Add a pin point a location and get its coordinates. Once selected left click on the point of interest to create the Marker. You can then export the marker as a KML file. |
|
Text Label | Add a text label onto the map. |
 Image Filters
You can modify the imagery displayed to your preference using the Image Filters tool.
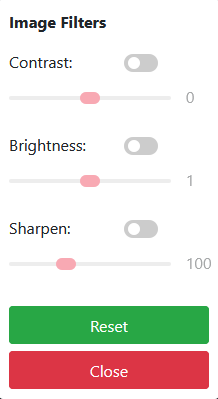
Each option can be enabled individually, adjusted and toggled:
- Contrast: affects the contrast of the image
- Brightness: Lightens or darkens the image
- Sharpen: Brings out additional details in the imagery, going too high can result in artifacts.
Note that going too high or low can result in clipping which reduces the amount of visable detail.