Logging In
When you login to MetroMap, you will get the login screen:
- Enter your username or email in the first box
- Enter your password in the second box
- Check your password using the eye icon
- Click LOGIN
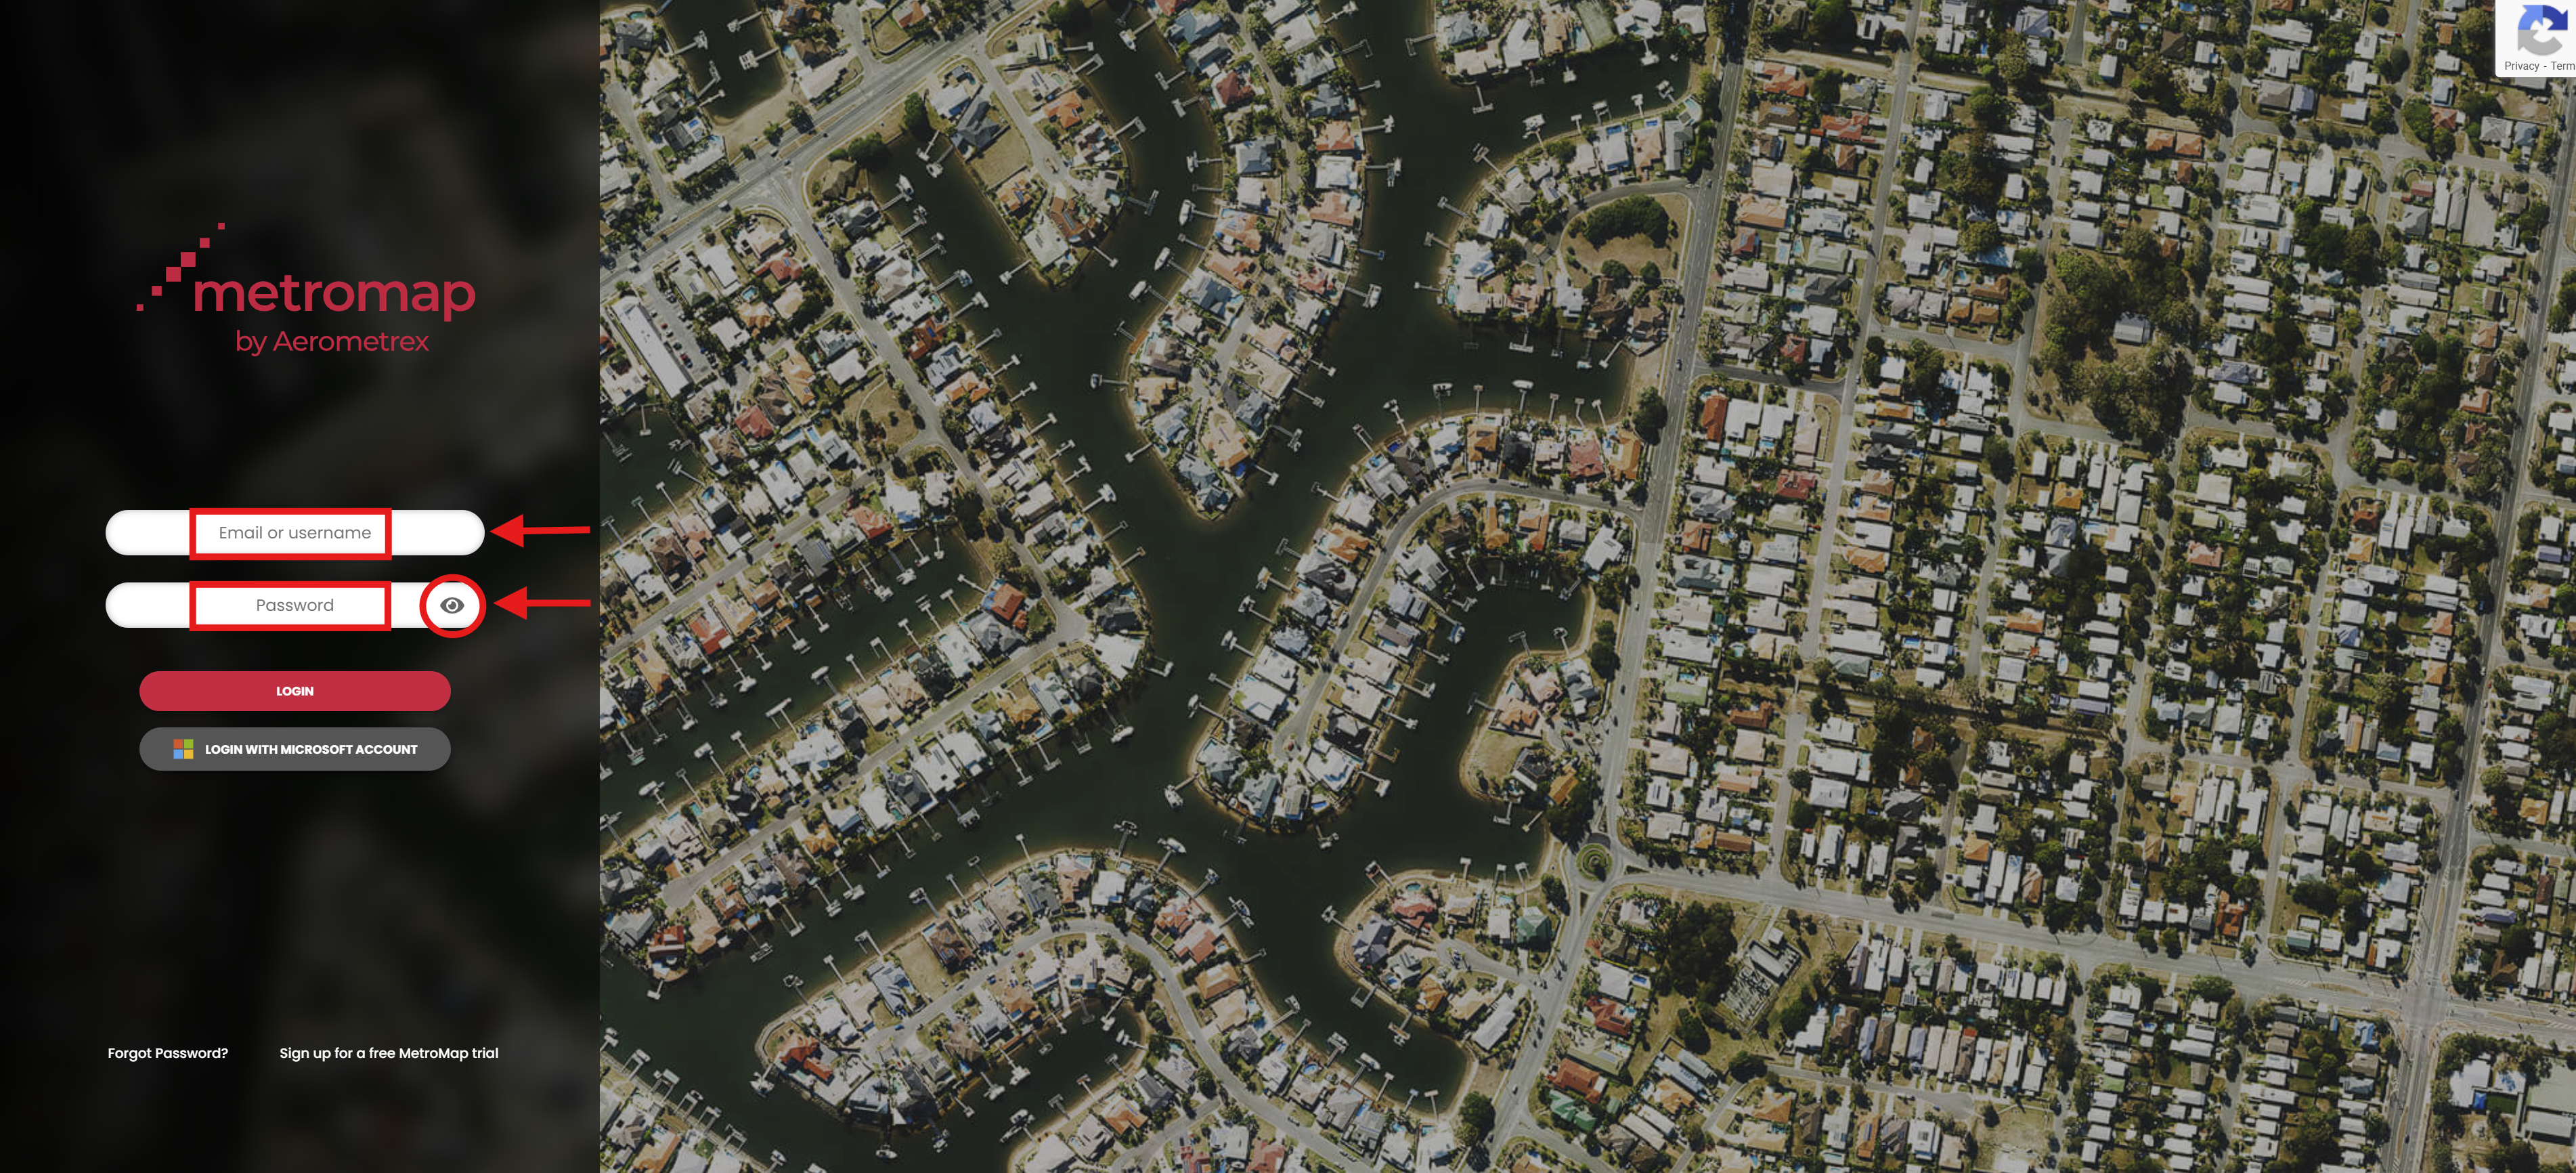
If your organisation has enabled Single Sign On (SSO) with us, just click the Login with Microsoft Account
1 This is the username you have received in the E-mail from us.
2 If you have forgotten your password, you can reset it here by following the instructions from Forgot Password? link on the screen.
MetroMap Browser 2D Interface
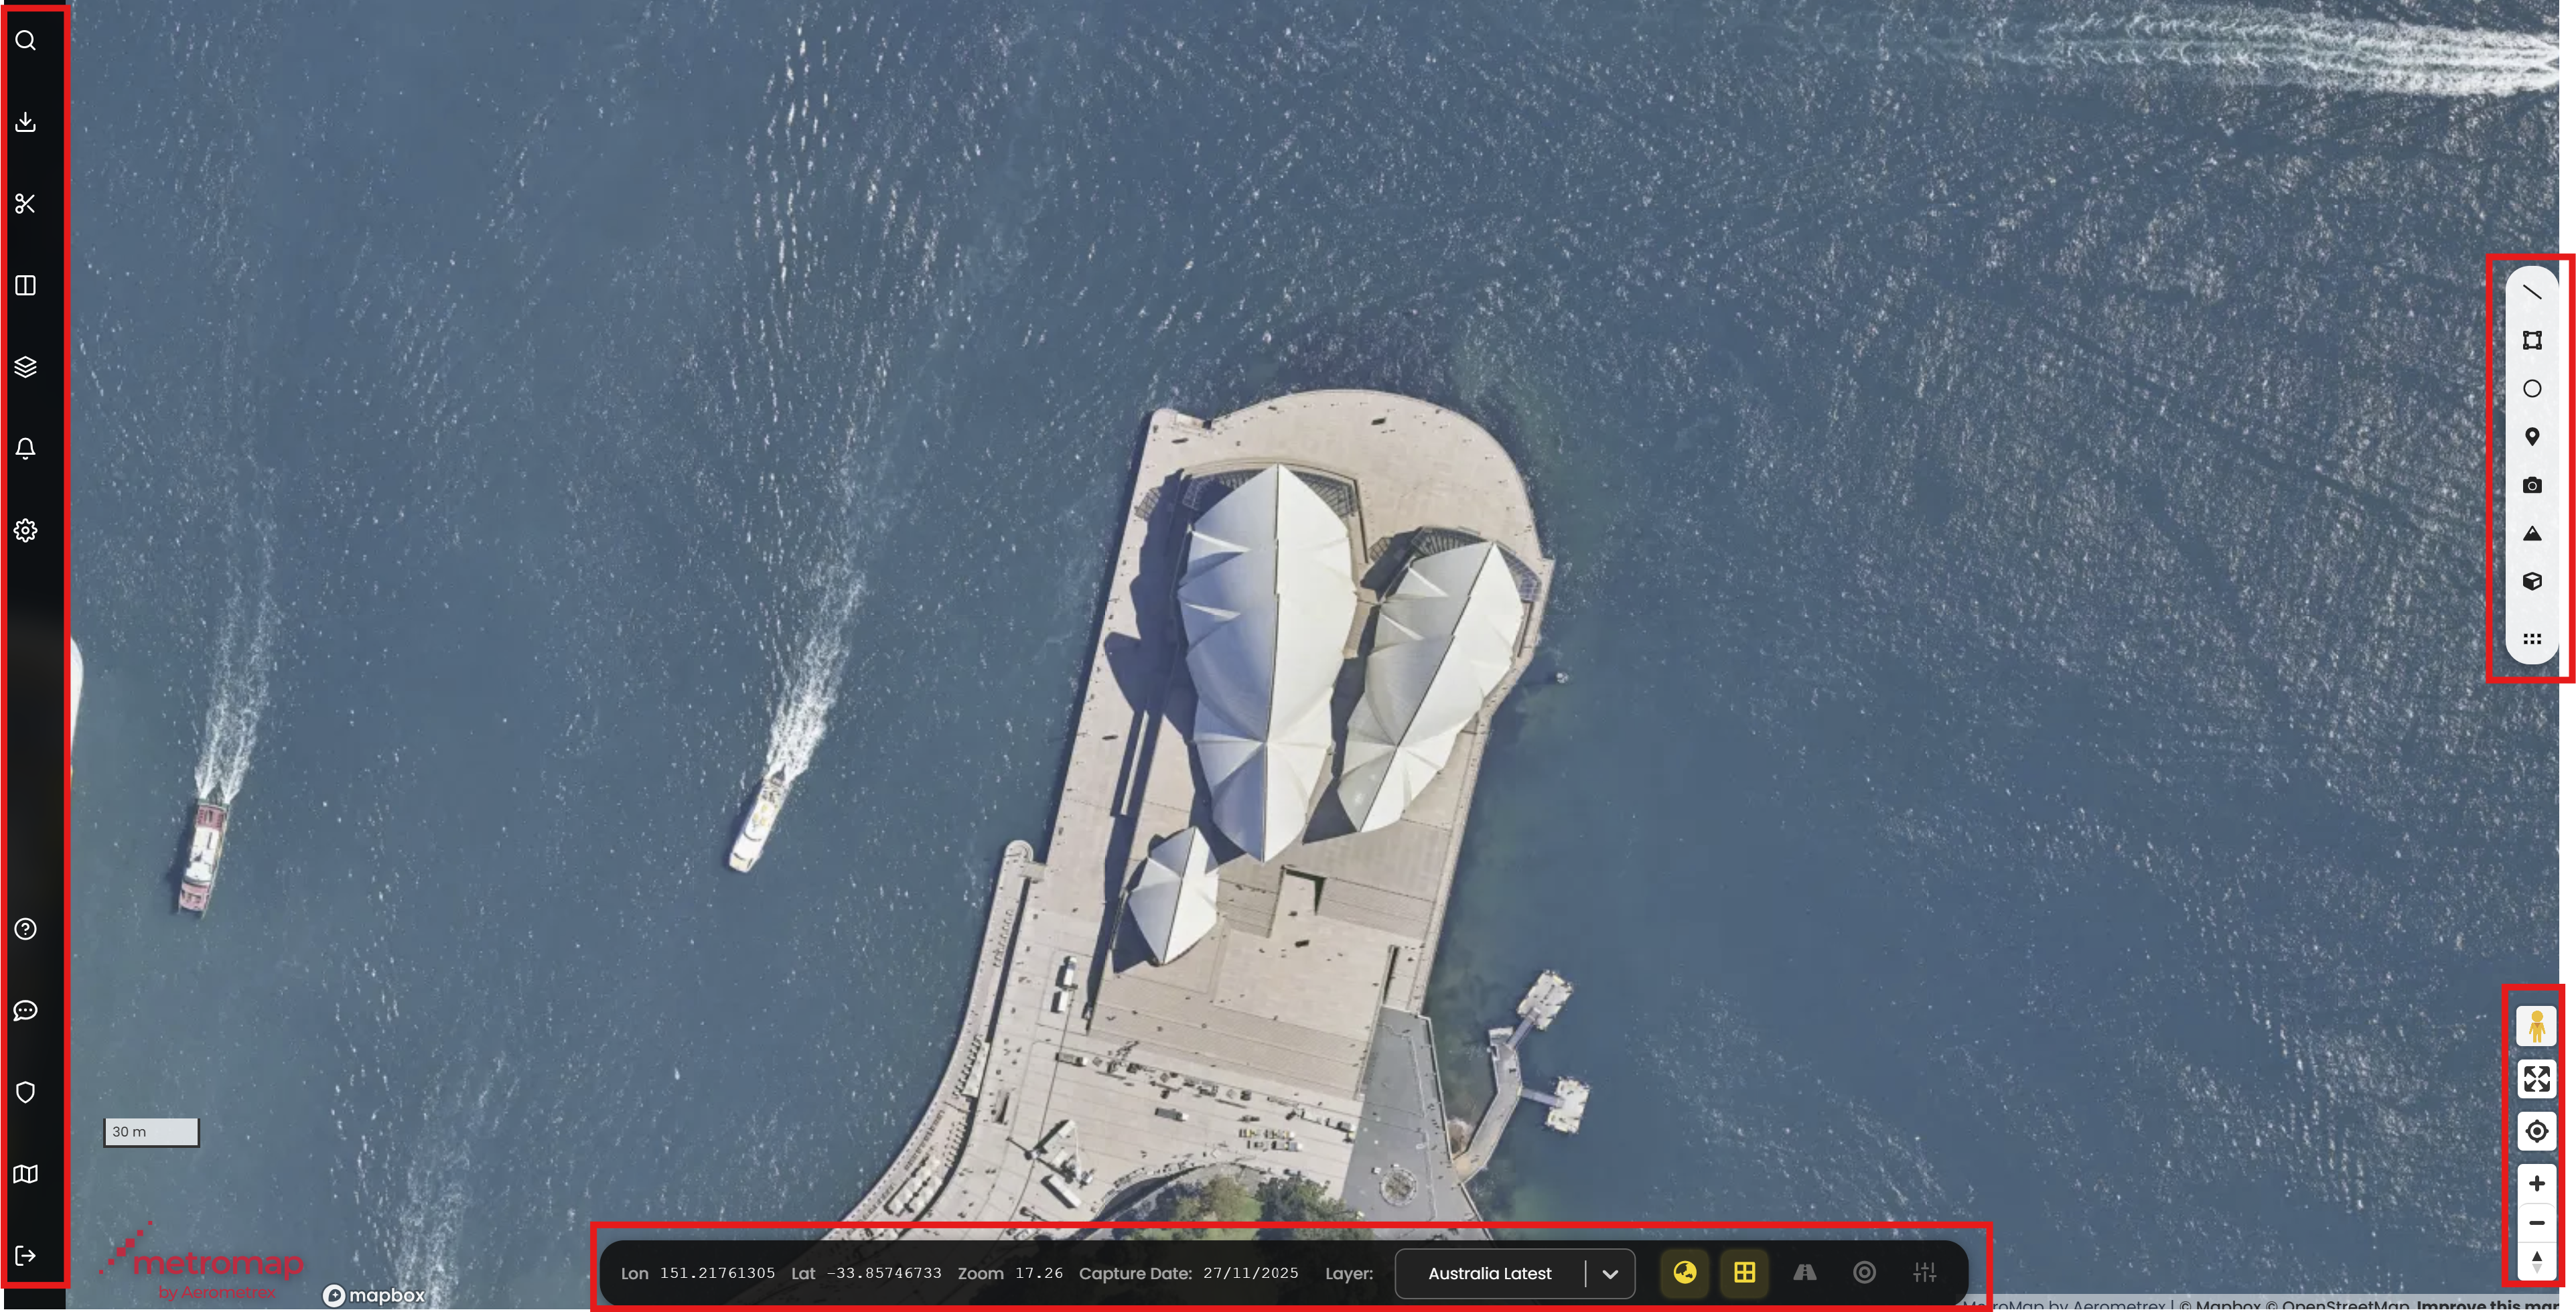
The MetroMap Browser 2D Interface is constructed by the following elements:
- Menu – Search, downloads, and account options
- Dockable Tool Bar – Floating drawing and editing tools
- Map Control Bar – Coordinates, imagery dates, and imagery controls
- Navigation – Pan, zoom, and map interaction
1. Menu
| Icons | Tool | Descriptions |
|---|---|---|
 |
Search | The Search button toggles the Search bar which allows for location searching via either address or coordinates. |
.png) |
Download | The Download button allows you to download imagery data through your browser in WGS84 projection for offline usage. |
 |
Clip it! | The Clip it! tool allows you to download larger, full resolution imagery in various projections for offline usage. You will receive a link to download the imagery via email. |
 |
Swipe | The Swipe button allows you to compare two different datasets at the same time by swiping between them. |
 |
Layers | The Layers button opens the menu that allows you to manage your drawings or vector data layers. |
 |
Preferences | The Preferences button allows the configuration of map settings. This includes changing the projection used in the map as well as the preferred base layer you wish the map to have. |
| Documentation | The Documentation button brings you to our documentation site, containing explanations and guides for all aspects of MetroMap. | |
 |
Give Feedback | The Give Feedback button lets you share your suggestions on how we can improve our product. |
 |
Admin Panel | The Admin Panel button lets Admin users access the admin panel. |
 |
Logout | The Logout button logs you out. |
2. Dockable Tool Bar
You can customise the position of this toolbar. Click and drag to move it, or double-click to flip it.
| Icons | Descriptions | |
|---|---|---|
 |
LineString | The LineString tool allows the user to create and accurately measure a line. Once selected left clicking creates new points and double clicking finishes the line. You can then export the line as a KML file. |
 |
Polygon | The Polygon tool allows users to accurately calculate areas using polygon shapes. Once selected left clicking creates new points and double clicking finishes the area. You can then export the area as a KML file. |
 |
Circle | For Enterprise Plans: The Circle tool allows users to create and calculate circular areas with a circle shape. Left-clicking first places the centre-point and a second click places a point of the outer ring with the straight-line distance between being the radius of the circle. Information available includes circle area, radius, and circumference. After saving, you can export the area as a KML file. |
 |
Marker | The Marker tool allows users to pin point a location and get its coordinates. Labels can also be created using this tool. Once the tool is selected, left clicking creates new marker on the map. You can then save it to add labels on screen or export the marker as a KML file. |
 |
Screenshot | The Screenshot tool allows the user to download a non-georeferenced JPG screen shot of the current view including the drawings available in the map. |
3. Map Control Bar
The Map Control Bar appears at the bottom of the map and provides quick access to key map information and controls. It helps you understand what you’re viewing on the map and lets you easily manage imagery and map layers as you explore.

Key information provided are:
- Shows your current map coordinates and zoom level.
- Displays the imagery capture date as you move your mouse across the map.
- Lets you select available imagery by date using the layer selector.
- Toggle Imagery on or off
- Toggle Boundary on or off
- Toggle Street name visibility
- Toggle Contours
- Apply Image Filters to images
You can change the date shown in a particular area by:
- Zoom in to your desired area which will help filter the images.
- Click on the layer selector tool as shown in the example below.
- Select your desired date.
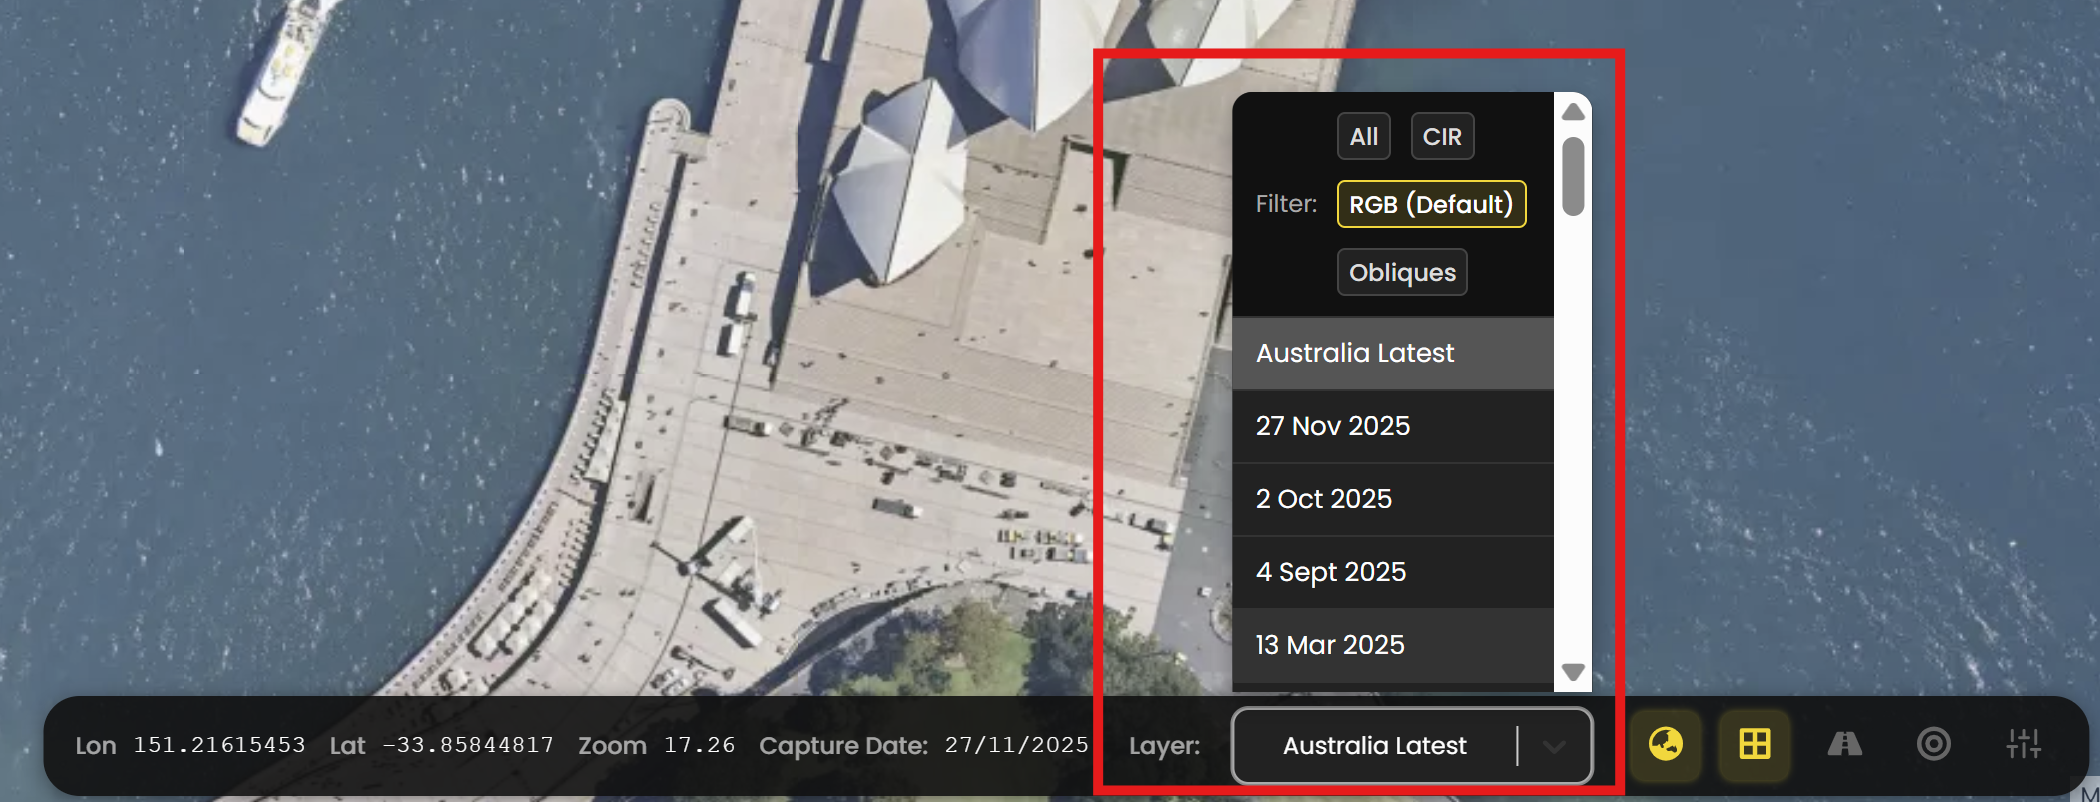
Only one imagery layer can be viewed at a time. Australia Latest is the default and shows the most recent imagery across Australia.
| Icon | Tool | Description |
|---|---|---|
 |
Toggle Imagery | Toggles MetroMap High Resolution Imagery on and off. |
 |
Toggle Boundary | Toggles MetroMap Boundary on and off. This boundary is the boundary that can be observed when you are zoomed out. This helps identify areas where images are available prior to rendering the imagery. |
 |
Toggle Roads | Toggles the display of roads on the map. |
| Toggle Contours | Toggles contour lines based on DTM data from the Elevation Profile Tool; zooming out to level 8 - 15 will show hillshade on the map. Contour Vector data will be visible from zoom levels 12 - 20. | |
 |
Image Filter | Adjusts imagery colour, contrast, and sharpening settings. |
4. Navigation
| Icons | Descriptions | |
|---|---|---|
| Street View | The Street view button can be dragged onto a street to display the Google Street View of that location. | |
  |
Zoom In Zoom Out |
The Zoom In and Zoom Out buttons allow the user to view a specific zoom layer, from an entire city to a single building. |
 |
North Arrow | The North Arrow can be dragged to rotate and shift the perspective of the imagery. The perspective can also be rotated by holding right click and dragging the mouse. If you want to reset back to the default simply click the button. |
You can also navigate the map using the arrow keys on your keyboard.